
Over the last few months I’ve been building a dashboard of music education data in the UK, understanding different aspects of the available datasets. Today on Twitter/X, there was a question from Anita Holford about what percentage of 16 year olds in England continue with music after Year 9.
A lot of this is hard to explore – the Ofqual data is not sortable by age, so you can’t see what age people are when they do Grade 6 music exams for example, this means identifying quite a tight frame for what we can (currently) know. I should also start by saying this post is written in a personal capacity and any mistakes are mine and mine alone!
We could discover what percentage of the Year 11 population have been entered into GCSE or in vocational qualifications though even if we can’t pull ABRSM or RSL stats. So we could start to get some sense of what the continuation level in ‘formal’ music education settings at this level, even if we can’t add in the Ofqual data by a comparable frame work.
If you’ve spent some time in DfE data, you’ll know about ‘build your own data tables’ in https://explore-education-statistics.service.gov.uk/ – it’s hugely useful to find particular sets of background data. So we can find the total number of Year 11s in the UK for 22/23. I’ve also added French as an example other subject.
England only data
| Total Number | |
| Number of Year 11s [Headcount] | 611,578 |
| Total number of pupils entered into GCSE Music | 29,867 |
| Total number of pupils entered into vocational music | 15,777 |
| Total number of pupils entered into GCSE Maths | 614,371 |
| Total number of pupils entered into GCSE French | 125,438 |
It seems fairly drastic, I’ve checked the Joint Council of Qualifications figures, who list in England in this same year 29,732 sat GCSE music.
Plotting the trend over the last decade is not pretty. I don’t have the percentage figures for all these years, this is the general history of the qualification. (note it doesn’t drop to nothing – the left axis starts at 29,000.)

This could just be a collapsing school population (without the percentage to check it by), so it’d be sensible to look at the population estimates here – I’ve looked at this two ways – firstly I’ve gone with the OfNS population estimates for each year. There is a track in the first few years, but then it all breaks around 2018. The population rises but the proportion taking GCSE music (now of the whole population, not the actual Year 11 stats as before)… tanks. (note this is a two axis graph with two sets of labels)
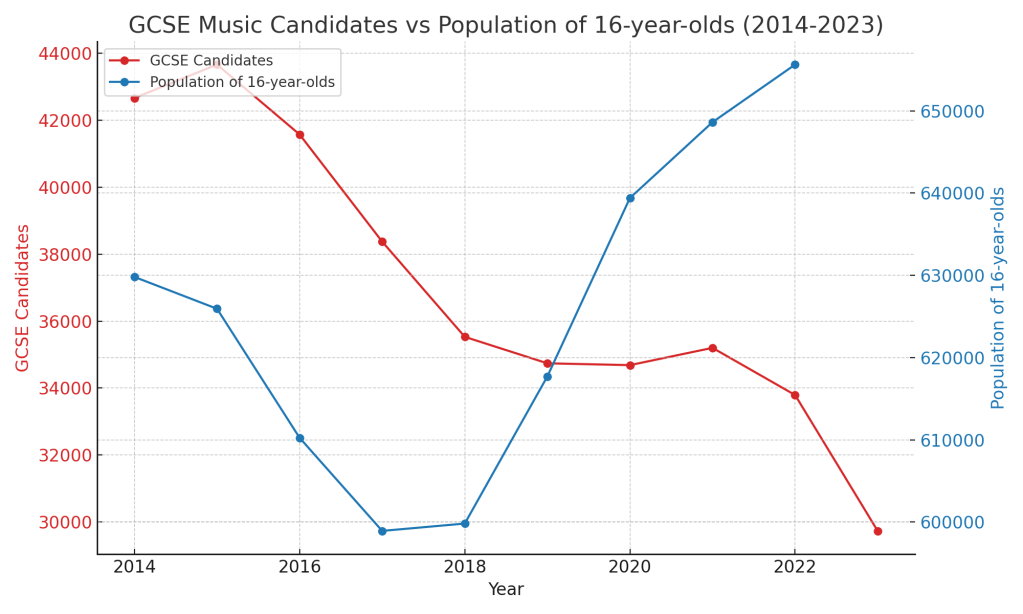
I’ve looked at the headcount using the DfE data as my second method here. Note this set starts a little later, and again, it isn’t pretty. (Be careful, the point they look like they meet is just the two axis points crossing, it’s not suddenly a mini triumph of gcse music).

All of this to say, there are some very big problems here in the ongoing sustainability of the qualification.
But the data along can’t tell us why this is happening, and crucially, it’s not a full picture though – until we can know how many young people are learning music in other settings, enjoying guitar lessons or playing Yousician and so on, we really can’t say that the non-GCSE music takers aren’t taking part. They just aren’t taking part in ways that look like GCSE music.
Next steps would be looking at LA level music data – is GCSE music falling in particular areas? Across particular demographics or types of school? If there are areas where GCSE music is prevalent, what’s happening differently? Can we identify schools that are bucking this trend and find out why they?
NB (I’ve made these charts with a variety of google sheets behind the scenes work and chatgpt’s plotting functionality)
